APM
Background
APM is the abbreviation for application performance monitoring.
Currently, APM mainly focuses its functions on the performance diagnosis of distributed systems, including call chain demonstration, application topology analysis and so on.
ShardingSphere is not responsible for gathering, storing and demonstrating APM related data, but sends the relevant core information of two data shards, SQL parsing and enforcement to APM to process. In other words, ShardingSphere is only responsible for generating valuable data and submitting it to relevant systems through standard protocol. It can connect to APM systems in two ways.
The first way is to send performance tracing data by OpenTracing API. APM products facing OpenTracing protocol can all automatically connect to ShardingSphere, like SkyWalking, Zipkin and Jaeger. In this way, users only need to configure the realizer of OpenTracing protocol at start. Its advantage is being able to take all the products compatible of OpenTracing protocol as the APM presentation system. If companies intend to implement their own APM systems, they only need to implement the OpenTracing protocol to demonstrate chain tracing information of ShardingSphere automatically. Its disadvantage is that OpenTracing protocol is not stable in its development, does not have relatively new versions, and is too neutral to be a strong support as native ones do to customized products.
The second way is to use SkyWalking’s automatic monitor agent.
ShardingSphere team cooperates with SkyWalking team and has realized the automatic monitor agent of ShardingSphere to automatically send relevant application performance data to SkyWalking.
Usage
Using OpenTracing
- Method 1: Inject the Tracer implementation class provided by APM system through reading system parameters.
Add startup arguments.
-Dio.shardingsphere.opentracing.tracer.class=org.apache.skywalking.apm.toolkit.opentracing.SkywalkingTracer
Call initialization method.
ShardingTracer.init();
ShardingTracer.init();
- Method 2: Inject the Tracer implementation class through method parameter.
ShardingTracer.init(new SkywalkingTracer());
Notice: when using SkyWalking’s OpenTracing agent, you should disable the former ShardingSphere agent to avoid the conflict between them.
Use SkyWalking’s Automatic Agent
Please refer to SkyWalking Manual.
Result Demonstration
No matter in which way, it is convenient to demonstrate APM information in the system connected. Take SkyWalking for example:
Application Architecture
Use Sharding-Proxy to visit two databases, 192.168.0.1:3306 and 192.168.0.2:3306, and there are two tables in each one of them.
Topology Demonstration
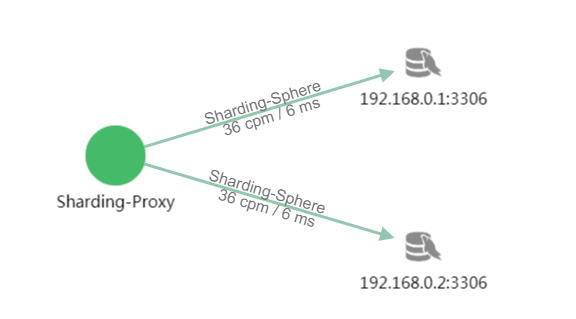
It can be seen from the picture that the user has accessed Sharding-Proxy 18 times, with each database twice each time. It is because two tables in each database are accessed each time, so there are totally four tables accessed each time.
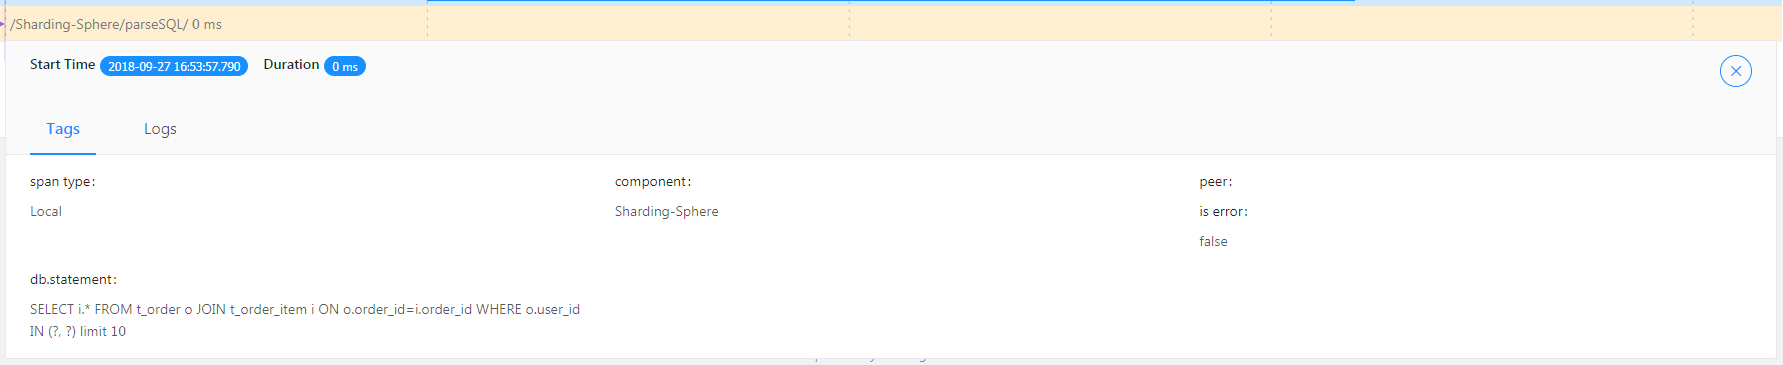
Tracking Demonstration
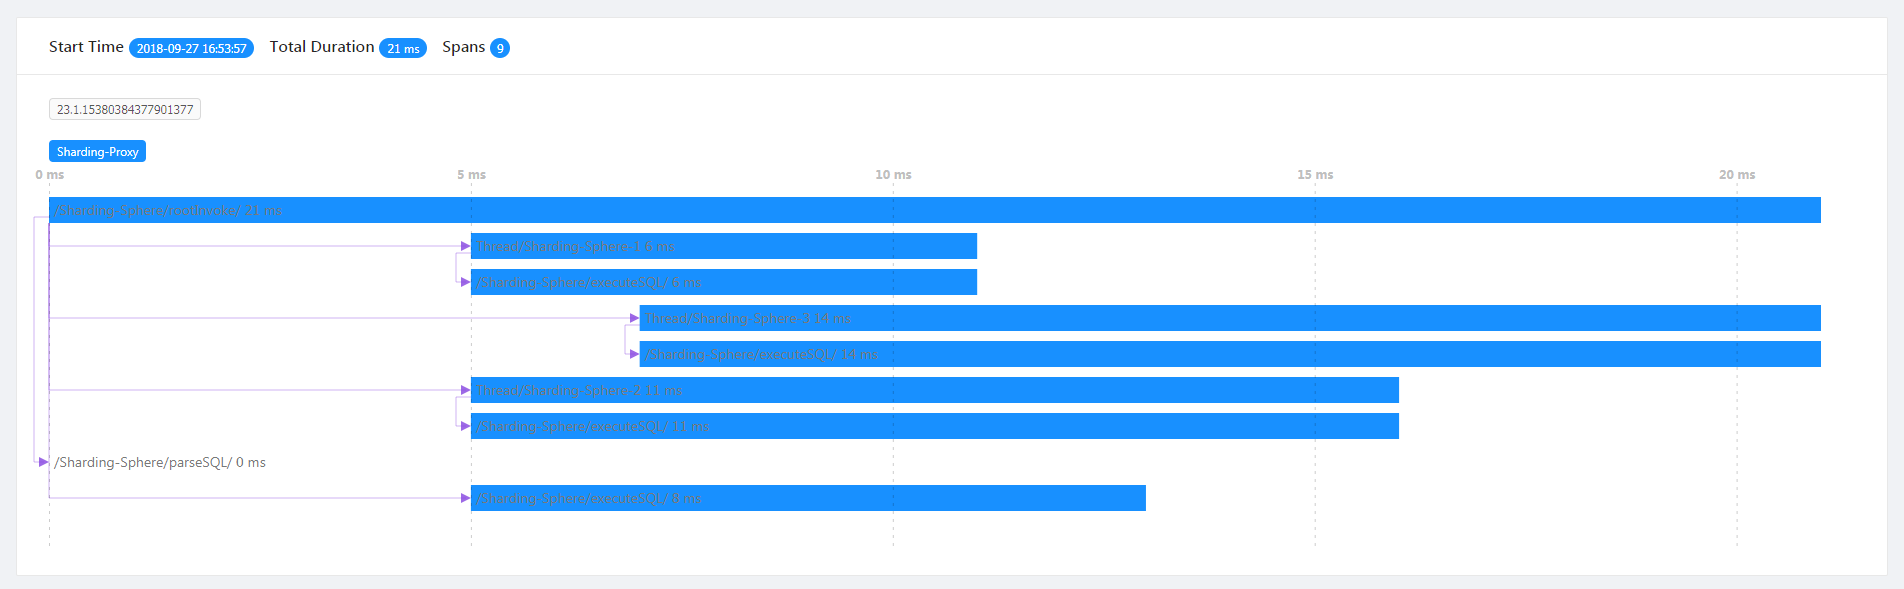
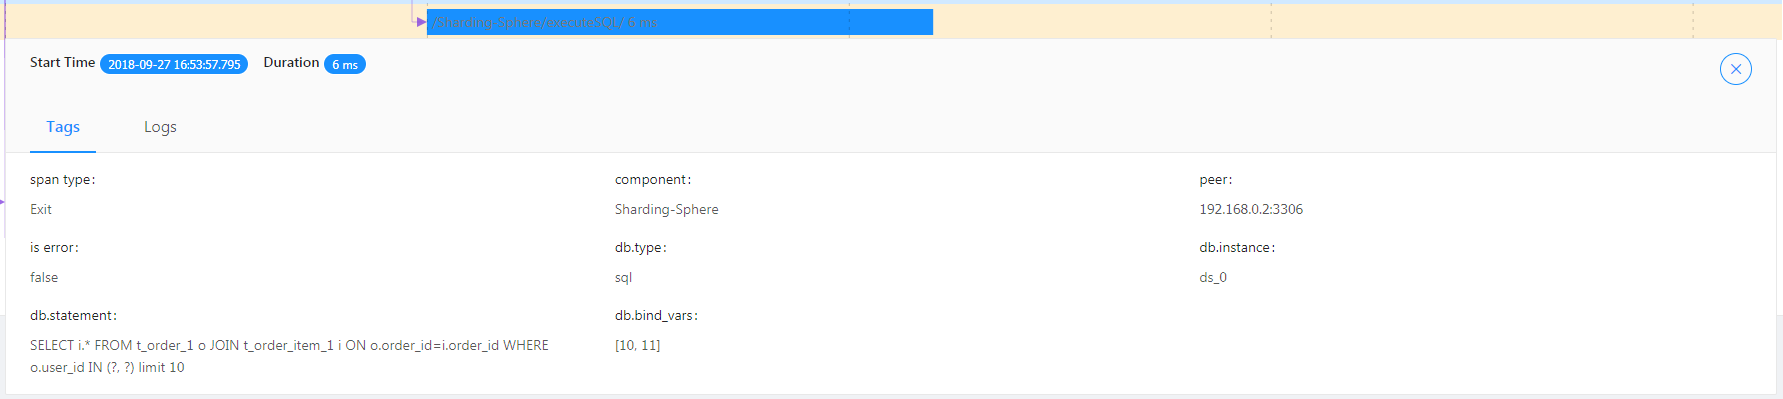
SQL parsing and implementation situation can be seen from the tracing diagram.
/Sharding-Sphere/parseSQL/ indicates SQL parsing performance this time.
/Sharding-Sphere/executeSQL/ indicates SQL parsing performance in actual execution.
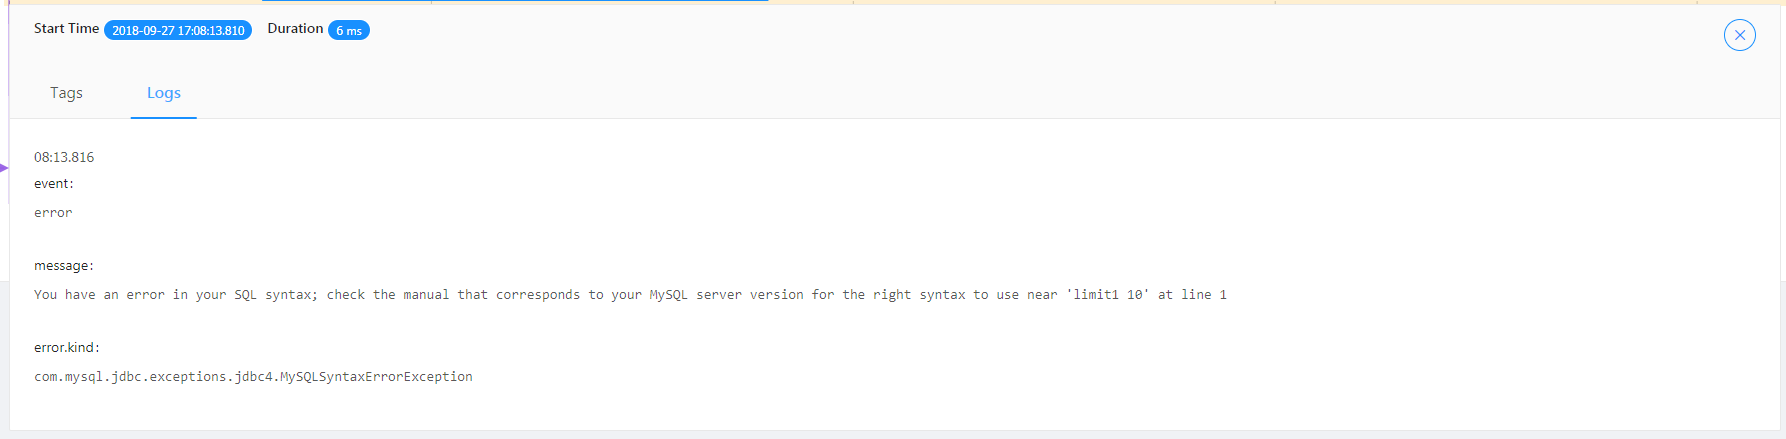
Exception Demonstration
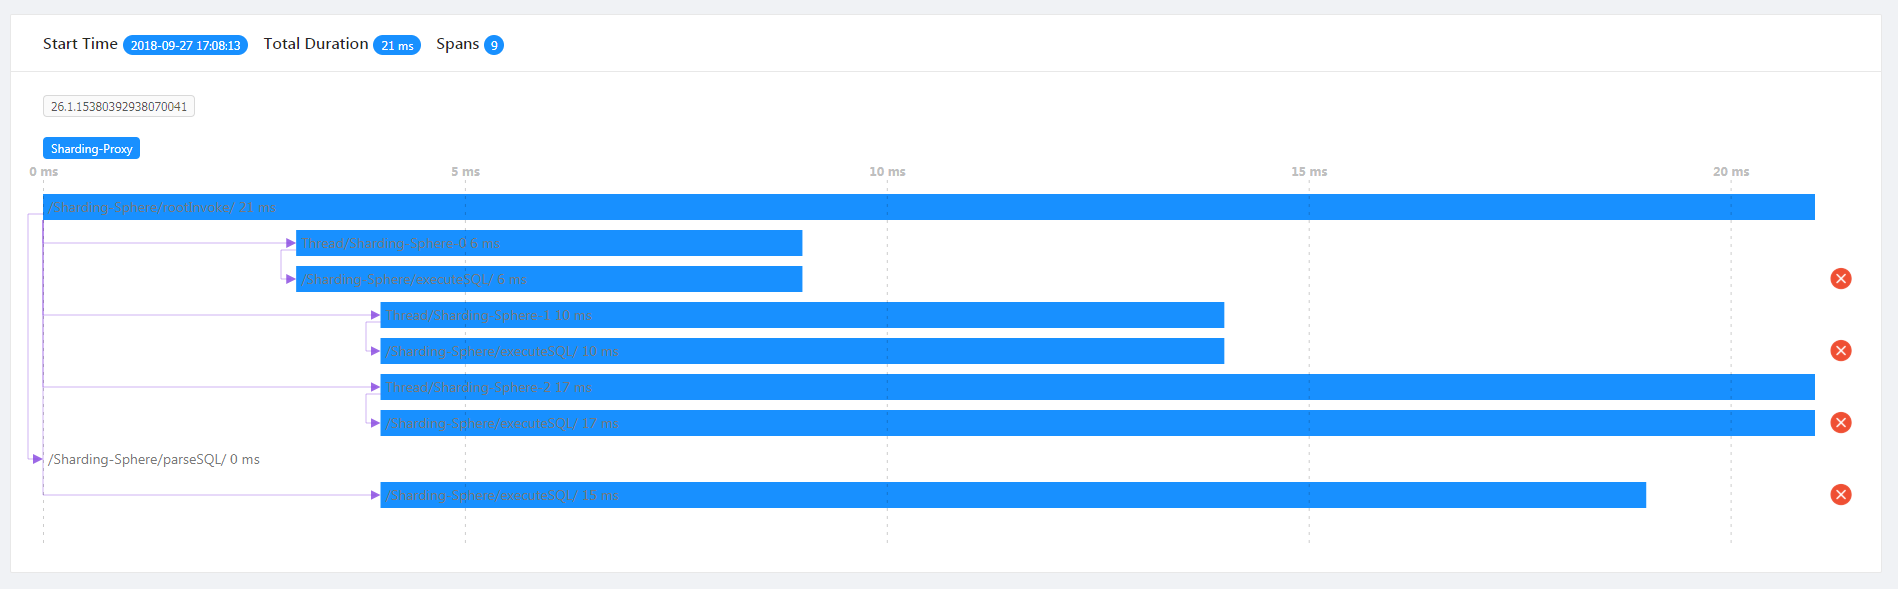
Exception nodes can be seen from the tracing diagram.
/Sharding-Sphere/executeSQL/ indicates exception results of SQL execution.
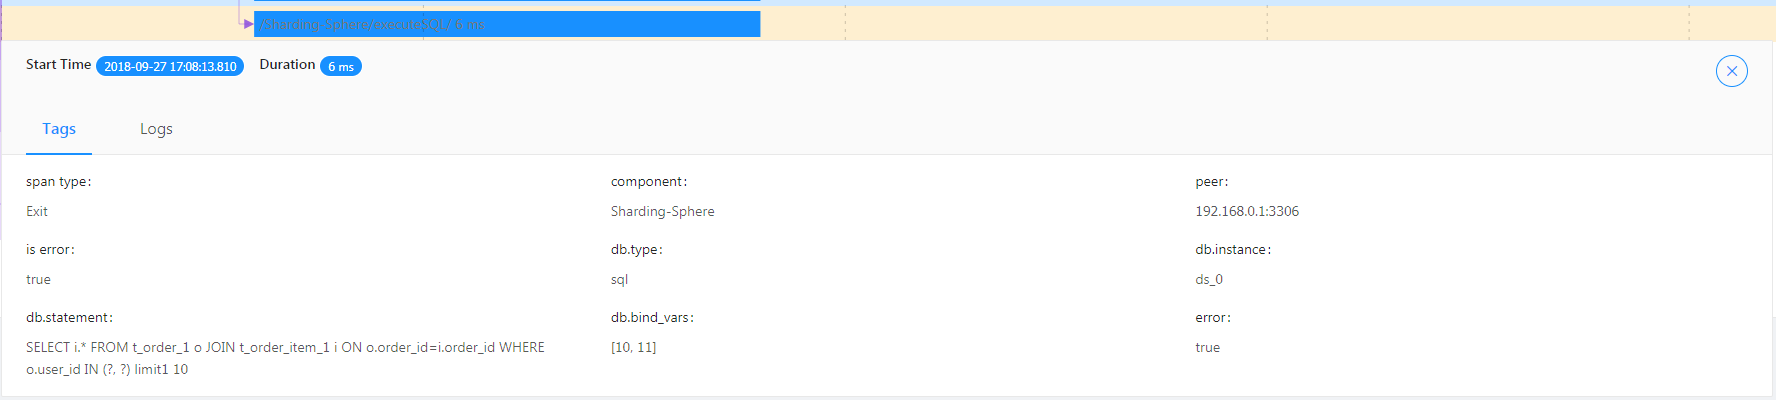
/Sharding-Sphere/executeSQL/ indicates the exception log of SQL execution.