Monitoring SQL Performance with ShardingSphere-Agent, Prometheus and Grafana

As business systems become more complex, users are increasingly concerned about system performance and the need to monitor relevant metrics during system operation. This includes obtaining real-time monitoring metric information, monitoring and warning of relevant issues, and combining business analysis to locate anomalies.
Application Performance Monitoring (APM) monitors and diagnoses system performance by collecting, storing, and analyzing system data that can be observed. Its main functions include performance metric monitoring, call chain analysis, and application topology maps. Generally, system operation status performance data is obtained through Metrics, Tracing, and Logging.
This article will explain how ShardingSphere-Agent collects ShardingSphere-JDBC monitoring metrics and how to display them visually.
Implementation
There are two methods that are generally considered when collecting metrics: manually tracking events in business methods and using Java Agent for non-intrusive event tracking. Method one has too much business intrusion and is not a good choice for including non-business logic in the business. Therefore, it is generally a better choice to use Java Agent for non-intrusive event tracking.
Depending on the Java Agent, modifying the bytecode of the target for data collection is also called probe technology. ShardingSphere-Agent uses Java Agent to add an agent proxy when JVM starts and use Byte Buddy to modify the target bytecode to implant data collection logic.
Module Introduction
shardingsphere-agent-api: Defines enhanced interfaces, plugin configurations, and more.
shardingsphere-agent-core: Defines plugin loading processes and agent entry.
shardingsphere-agent-plugins: Defines plugins.
This article mainly introduces the indicator plugin under the shardingsphere-agent-plugins module. Under this module, the indicator plugin mainly has the following modules.
shardingsphere-agent-metrics-core: Indicator collection definition moduleshardingsphere-agent-metrics-prometheus: Indicator data exposure module
Event Tracking Setting
Meaningful classes should be considered for tracking. For example, in ShardingSphere-JDBC, the most commonly used and important are the ShardingSphereStatement and ShardingSpherePreparedStatement. We often use the execute, executeQuery, and executeUpdate methods of these two classes to run SQL, so these methods are also the most important places we should pay attention to. The relevant metrics can be collected through these methods too.
For example, the execution time counts of these methods can be tracked. The existing indicator jdbc_statement_execute_latency_millis logs the execute, executeQuery, and executeUpdate methods of ShardingSphereStatement and ShardingSpherePreparedStatement and tracks the execution time of methods.
Metrics
ShardingSphere-JDBC Monitoring Metrics
The monitoring metrics collected by ShardingSphere-Agent comply with the OpenMetrics standard. The following table describes the metrics:
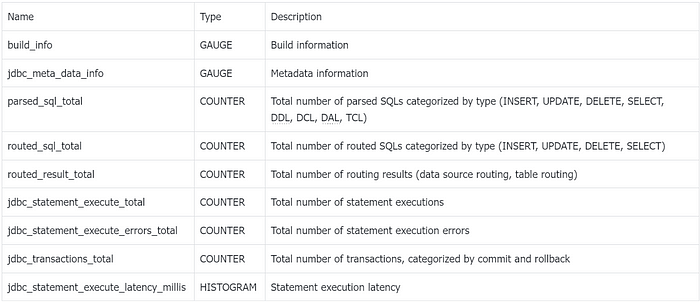
These metrics can be used to monitor the performance of ShardingSphere-JDBC and identify any issues that may arise. The metrics are collected and displayed visually using the indicator plugin under the shardingsphere-agent-plugins module.
JVM Monitoring Metrics
In addition to collecting metrics for ShardingSphere-JDBC, ShardingSphere-Agent also exposes relevant metrics for the JVM. The following table describes these metrics:
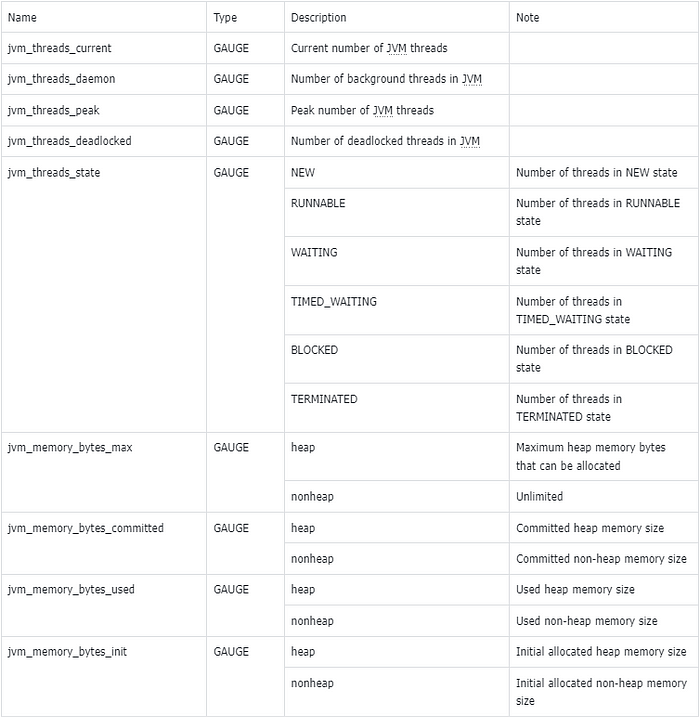
These metrics can be used to monitor the performance of the JVM and identify any issues that may arise. The metrics are collected and displayed visually using the indicator plugin under the shardingsphere-agent-plugins module.
Metric Type Explanation:
- GAUGE-type metrics indicate that the metric value can increase or decrease.
- COUNTER-type metrics indicate that the metric value can only increase and never decrease.
- HISTOGRAM-type metrics represent a histogram that is mainly used for the distribution of metric values, such as the method execution time.
User Guide
Example using a Spring Boot project integrated with ShardingSphere-JDBC: To demonstrate how to collect and display metrics using ShardingSphere-Agent, we will use a Spring Boot project that integrates with ShardingSphere-JDBC. Follow the steps below to set up the project:
- Download the spring-boot-shardingsphere-jdbc-test.jar file. You can find instructions on how to configure it from the official ShardingSphere documentation [1].
- Download ShardingSphere-Agent from the official website [2]. Note that ShardingSphere-JDBC and ShardingSphere-Agent must be of the same version and supported from version 5.3.2.
- Set up the ShardingSphere-Agent directory structure as follows:
cd agent
tree
├── LICENSE
├── NOTICE
├── conf
│   └── agent.yaml
├── plugins
│   ├── lib
│   │   ├── shardingsphere-agent-metrics-core-${latest.release.version}.jar
│   │   └── shardingsphere-agent-plugin-core-${latest.release.version}.jar
│   ├── logging
│   │   └── shardingsphere-agent-logging-file-${latest.release.version}.jar
│   ├── metrics
│   │   └── shardingsphere-agent-metrics-prometheus-${latest.release.version}.jar
│   └── tracing
│       ├── shardingsphere-agent-tracing-opentelemetry-${latest.release.version}.jar
└── shardingsphere-agent-${latest.release.version}.jar
- Configure the
agent.yamlfile to enable monitoring.
plugins:
  metrics:
    Prometheus:
      host:  "localhost"
      port: 39090
      props:
        jvm-information-collector-enabled: "true"
Configuration details:
hostrepresents the IP address at which the metrics are exposed on the local machine. The default islocalhost.portrepresents the port on which the metrics are exposed.jvm-information-collector-enabledrepresents whether JVM-related metric information is collected. The default istrue.
Start the project
java -javaagent:${agentPath}/agent/shardingsphere-agent-${latest.release.version}.jar -jar spring-boot-shardingsphere-jdbc-test.jar
Note: The javaagent should be configured with the absolute path of the jar file.
After the project is started, make requests to the relevant business interfaces in the project to trigger the related tracking and generate metric data.
Next, visit http://127.0.0.1:39090, where the exposed metrics data is located, to obtain data information. The following is the screenshot of some metrics:
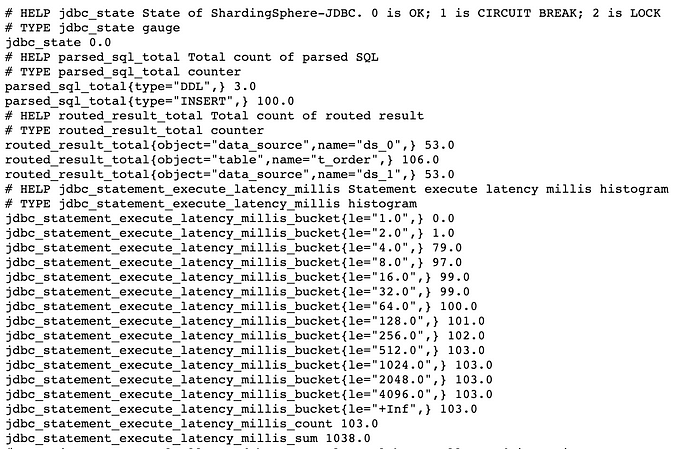
Note:
The jdbc_statement_execute_latency_millis_bucket, jdbc_statement_execute_latency_millis_count, and jdbc_statement_execute_latency_millis_sum in the above screenshot are derived from the jdbc_statement_execute_latency_millis metric.
According to the metric specification, when a HISTOGRAM-type metric is generated, metrics with the suffix _bucket, _count, and _sum are automatically generated. We will discuss how to use them later.
In production scenarios, Prometheus is often used for metric collection and storage, and Grafana is used for visualization. Next, we will configure Prometheus and Grafana.
Prometheus
Add the following configuration to the prometheus.yml file to collect monitoring data. For detailed usage of Prometheus, please refer to the Prometheus official website [3].
scrape_configs:
  - job_name: "jdbc"
    static_configs:
      - targets: ["127.0.0.1:39090"]
Grafana
To visualize the collected monitoring data in Grafana, we need to set up a Prometheus data source and write PromQL queries to extract the desired metric data. For more information on using Grafana, please refer to the official website [4]. To learn how to use PromQL, please refer to the official documentation [5].
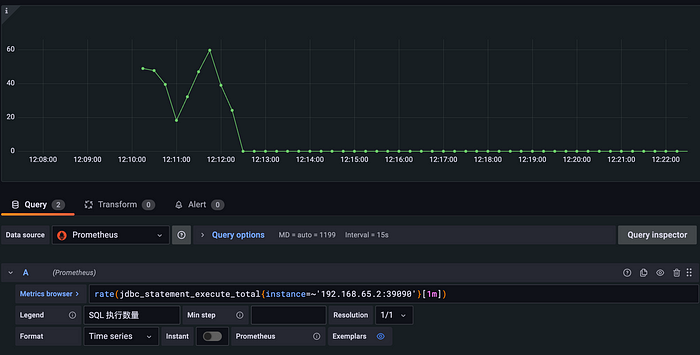
As an example, we can use the jdbc_statement_execute_total metric to display the average number of SQL statements executed per minute. Here is an example of how to achieve this:
rate(jdbc_statement_execute_total{instance=~'192.168.65.2:39090'}[1m])
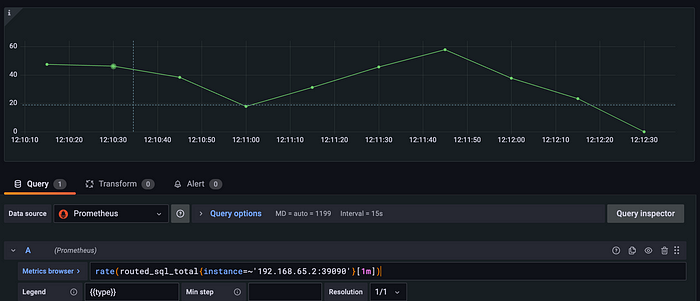
To view SQL metrics routed to the backend database, the routed_sql_total metric can be used for display. This metric uses the type tag to separate SQL statements by their types (INSERT, UPDATE, DELETE, and SELECT), making it easier to analyze the statistics of different types of SQL.
rate(routed_sql_total{instance=~'192.168.65.2:39090'}[1m])
Other COUNTER-type metrics can be obtained using a similar PromSQL statement. We encourage you to try them out yourself.
Often, we are more concerned about the time it takes to execute SQL statements. In this case, the jdbc_statement_execute_latency_millis metric is exactly what we need. The format and meaning of the exposed original metric are explained below:
# HELP jdbc_statement_execute_latency_millis Statement execute latency millis histogram
# TYPE jdbc_statement_execute_latency_millis histogram
jdbc_statement_execute_latency_millis_bucket{le="1.0",} 0.0
jdbc_statement_execute_latency_millis_bucket{le="2.0",} 898.0
jdbc_statement_execute_latency_millis_bucket{le="4.0",} 5065.0
jdbc_statement_execute_latency_millis_bucket{le="8.0",} 5291.0
jdbc_statement_execute_latency_millis_bucket{le="16.0",} 5319.0
jdbc_statement_execute_latency_millis_bucket{le="32.0",} 5365.0
jdbc_statement_execute_latency_millis_bucket{le="64.0",} 5404.0
jdbc_statement_execute_latency_millis_bucket{le="128.0",} 5405.0
jdbc_statement_execute_latency_millis_bucket{le="256.0",} 5458.0
jdbc_statement_execute_latency_millis_bucket{le="512.0",} 5459.0
jdbc_statement_execute_latency_millis_bucket{le="1024.0",} 5459.0
jdbc_statement_execute_latency_millis_bucket{le="2048.0",} 5459.0
jdbc_statement_execute_latency_millis_bucket{le="4096.0",} 5459.0
jdbc_statement_execute_latency_millis_bucket{le="+Inf",} 5459.0
jdbc_statement_execute_latency_millis_count 5459.0
jdbc_statement_execute_latency_millis_sum 27828.0
- The
jdbc_statement_execute_latency_millis_bucket{le="1.0",} 0.0indicates the number of times the execution time is within 1 millisecond, which is 0 in this case. - The
jdbc_statement_execute_latency_millis_bucket{le="2.0",} 898.0indicates the number of times the execution time is within 2 milliseconds, which is 898 in this case. - The
jdbc_statement_execute_latency_millis_bucket{le="4.0",} 5065.0indicates the number of times the execution time is within 4 milliseconds, which is 5065 in this case. - In line 16, “+Inf” represents statistics beyond the maximum execution time, which in this case represents statistics beyond 4096 milliseconds.
- The
jdbc_statement_execute_latency_millis_count 5459.0represents the total number of executions, which is 5459 in this case. - The
jdbc_statement_execute_latency_millis_sum 27828.0represents the total execution time, which is 27828 milliseconds in this case.
ceil(sum(increase(jdbc_statement_execute_latency_millis_bucket{instance=~'192.168.65.2:39090', le!='+Inf'}[1m])) by (le))
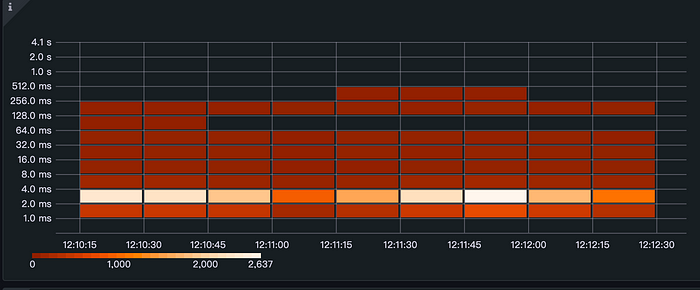
The heat map effectively visualizes the distribution of execution time, providing valuable insights into the performance of the system.
Many metrics can be collected and analyzed using Prometheus and Grafana. By monitoring these metrics and identifying patterns and trends in the data, users can gain valuable insights into the performance and health of their systems, and take proactive measures to optimize performance and prevent issues before they occur.
Conclusion
We welcome you to actively participate in enriching and improving the monitoring indicators of ShardingSphere-JDBC. If you have any questions or suggestions, please feel free to raise them in the GitHub issue [6], or join our Slack community [7] for discussions.
Related Links
[1] ShardingSphere-JDBC official website documentation
[2] ShardingSphere-Agent download address
[3] Prometheus official website
[5] PromSQL official documentation
[6] GitHub issues
[7] Slack community