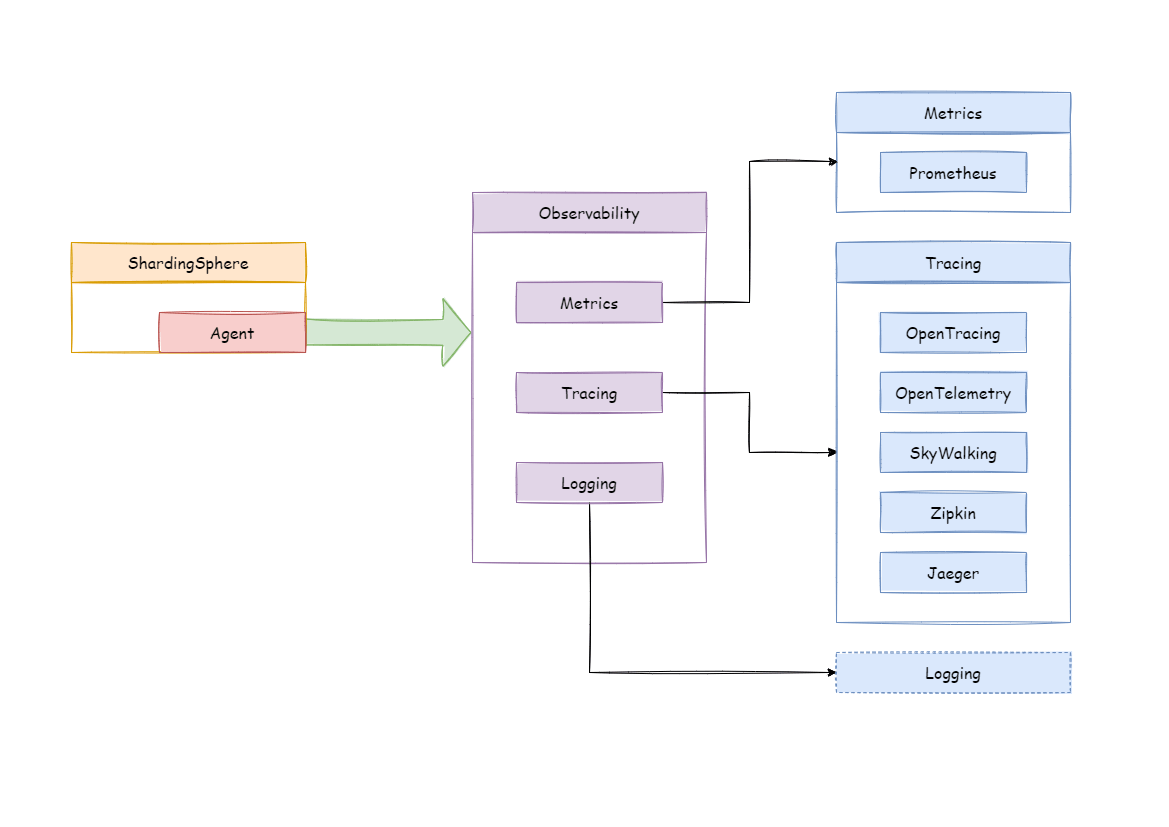
In order to grasp the distributed system status, observe running state of the cluster is a new challenge. The point-to-point operation mode of logging in to a specific server cannot suite to large number of distributed servers. Telemetry through observable data is the recommended operation and maintenance mode for them. Tracking, metrics and logging are important ways to obtain observable data of system status.
APM (application performance monitoring) is to monitor and diagnose the performance of the system by collecting, storing and analyzing the observable data of the system. Its main functions include performance index monitoring, call stack analysis, service topology, etc.
Apache ShardingSphere is not responsible for gathering, storing and demonstrating APM data, but provides the necessary information for the APM. In other words, Apache ShardingSphere is only responsible for generating valuable data and submitting it to relevant systems through standard protocols or plug-ins. Tracing is to obtain the tracking information of SQL parsing and SQL execution. Apache ShardingSphere provides support for SkyWalking, Zipkin, Jaeger and OpenTelemetry by default. It also supports users to develop customized components through plug-in.
Use Zipkin or Jaeger Just provides correct Zipkin or Jaeger server information in the agent configuration file.
Use OpenTelemetry OpenTelemetry was merged by OpenTracing and OpenCencus in 2019. In this way, you only need to fill in the appropriate configuration in the agent configuration file according to OpenTelemetry SDK Autoconfigure Guide.
Use SkyWalking Enable the SkyWalking plug-in in configuration file and need to configure the SkyWalking apm-toolkit.
Use SkyWalking’s automatic monitor probe Cooperating with Apache SkyWalking team, Apache ShardingSphere team has realized ShardingSphere automatic monitor probe to automatically send performance data to SkyWalking. Note that automatic probe in this way cannot be used together with Apache ShardingSphere plug-in probe.
Metrics used to collect and display statistical indicator of cluster. Apache ShardingSphere supports Prometheus by default.

Tracing and metrics need to collect system information through event tracking. Lots of events tracking make kernel code mess, difficult to maintain, and difficult to customize extend.
The goal of Apache ShardingSphere observability module is providing as many performance and statistical indicators as possible and isolating kernel code and embedded code.
ShardingSphere provides observability for applications through the Agent module, and this feature applies to the following scenarios:
The system’s static information (such as application version) and dynamic information (such as the number of threads and SQL processing information) are exposed to a third-party application (such as Prometheus) using a standard interface. Administrators can visually monitor the real-time system status.
In ShardingSphere, a SQL statement needs to go through the processes of parsing, routing, rewriting, execution, and result merging before it is finally executed and the response can be output. If a SQL statement is complex and the overall execution takes a long time, how do we know which procedure has room for optimization?
Through Agent plus Tracing, administrators can learn about the time consumption of each step of SQL execution. Thus, they can easily locate performance risks and formulate targeted SQL optimization schemes.
In a distributed application plus data sharding scenario, it is tricky to figure out which node the SQL statement is issued from and which data source the statement is finally executed on. If an exception occurs during SQL execution, how do we locate the node where the exception occurred?
Agent + Tracing can help users solve the above problems.
Through tracing the full link of the SQL execution process, users can get complete information such as “where the SQL comes from and where it is sent to”.
They can also visually observe the SQL routing situation through the generated topological graph, make timely responses, and quickly locate the root cause of problems.
