APM
The brief
APM is the abbreviation of Application Performance Monitoring. Currently its core function is the performance diagnosis of distributed system, including call chain demonstration, application topology analysis, etc.
Sharding-JDBC Team work with SkyWalking Team to introduce an automatic prober of Sharding-JDBC to send the performance data of Sharding-JDBC to SkyWalking.
Usage
Using the SkyWalking plugin
Please refer to SkyWalking Manual。
Using OpenTracing plugin
If you want to use other APM systems which support OpenTracing, you can use the sharding-jdbc-opentracing plugin to work with those APM systems.
Notices: When using SkyWalking’s OpenTracing probe, disabling the original ShardingJDBC probe plugin is necessary to avoid conflicting with each other.
Results display
The application architecture
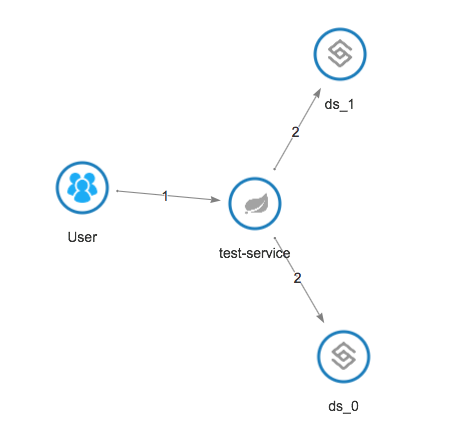
The application is a SpringBoot application, using Sharding - JDBC to access two databases of ds_0 and ds_1, and each owns two tables in the database.
The topology diagram display

Although the user accesses the application once, each database is accessed twice. This is because this visit involves two splitting tables in each database, four tables in total.
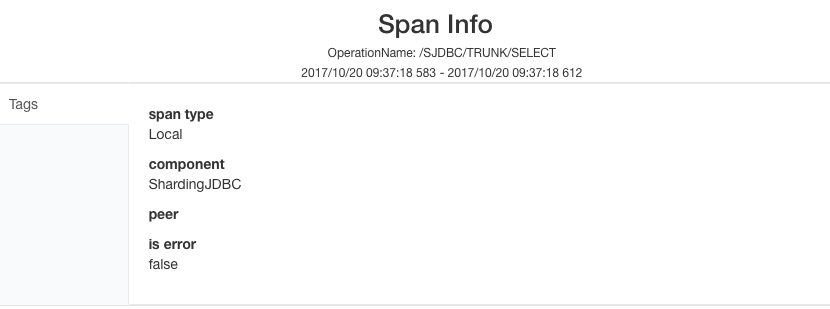
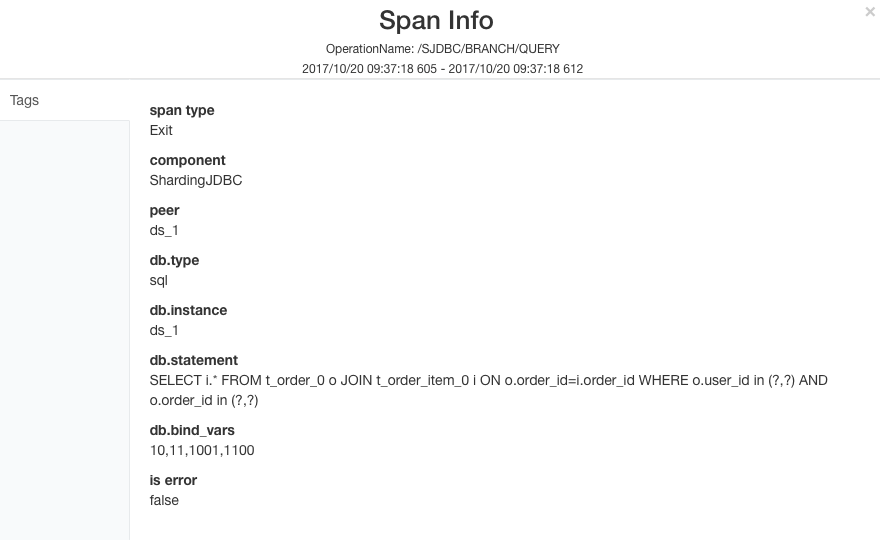
Data tracking display

Four visits in total in this figure.
/SJDBC/TRUNK/* : Represents the overall execution performance of this SQL.

/SJSBC/BRANCH/* : Represents the performance of the actual SQL.
